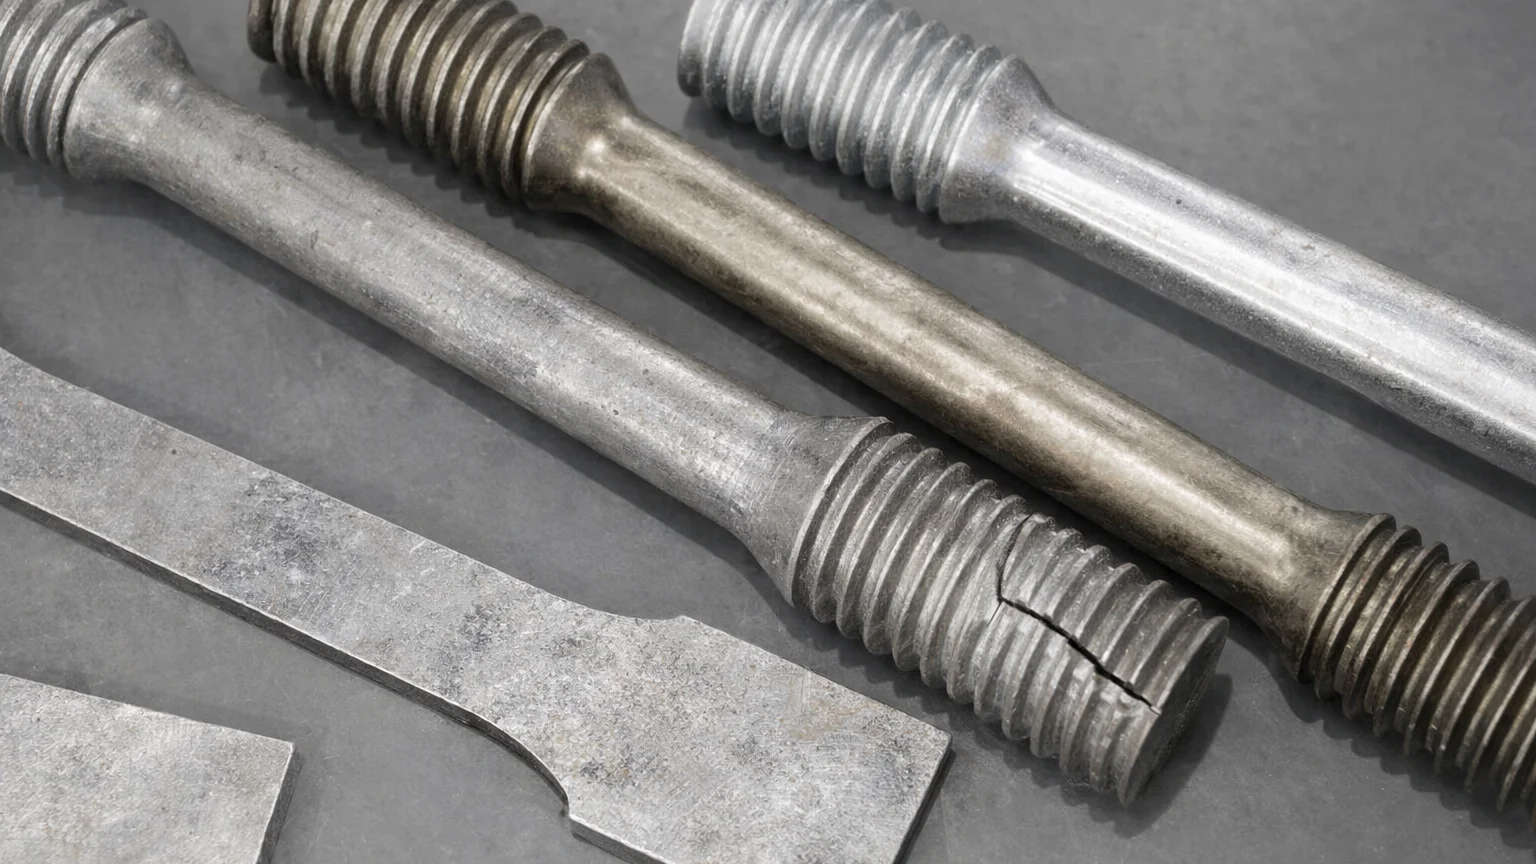
If test data does not repeat, the first question should not be about the test frame. It should be about the specimen. Small preparation issues can create measurable bias and scatter, especially in tensile testing where stress is calculated from force and cross sectional area. ASTM E8/E8M cautions that improper specimen preparation is often behind incorrect results, while ASTM E23 emphasizes that notch tolerances are critical because variations can seriously affect impact outcomes.
For QA and QC teams and lab managers, this article explains how specimen preparation affects repeatability and cost in tensile testing, with brief impact and fatigue considerations. It includes a practical cost breakdown and a simple monthly loss calculator.
Why A “Bad Specimen” Is Not A Small Mistake, But An Expensive One
Specimen preparation is part of the test system. When prep introduces dimensional error, surface damage, cold work, or excessive heat, the results can become biased or unnecessarily variable. That loss of data quality shows up quickly as retests, rework, delayed decisions, and disputes.
Bias Vs Scatter
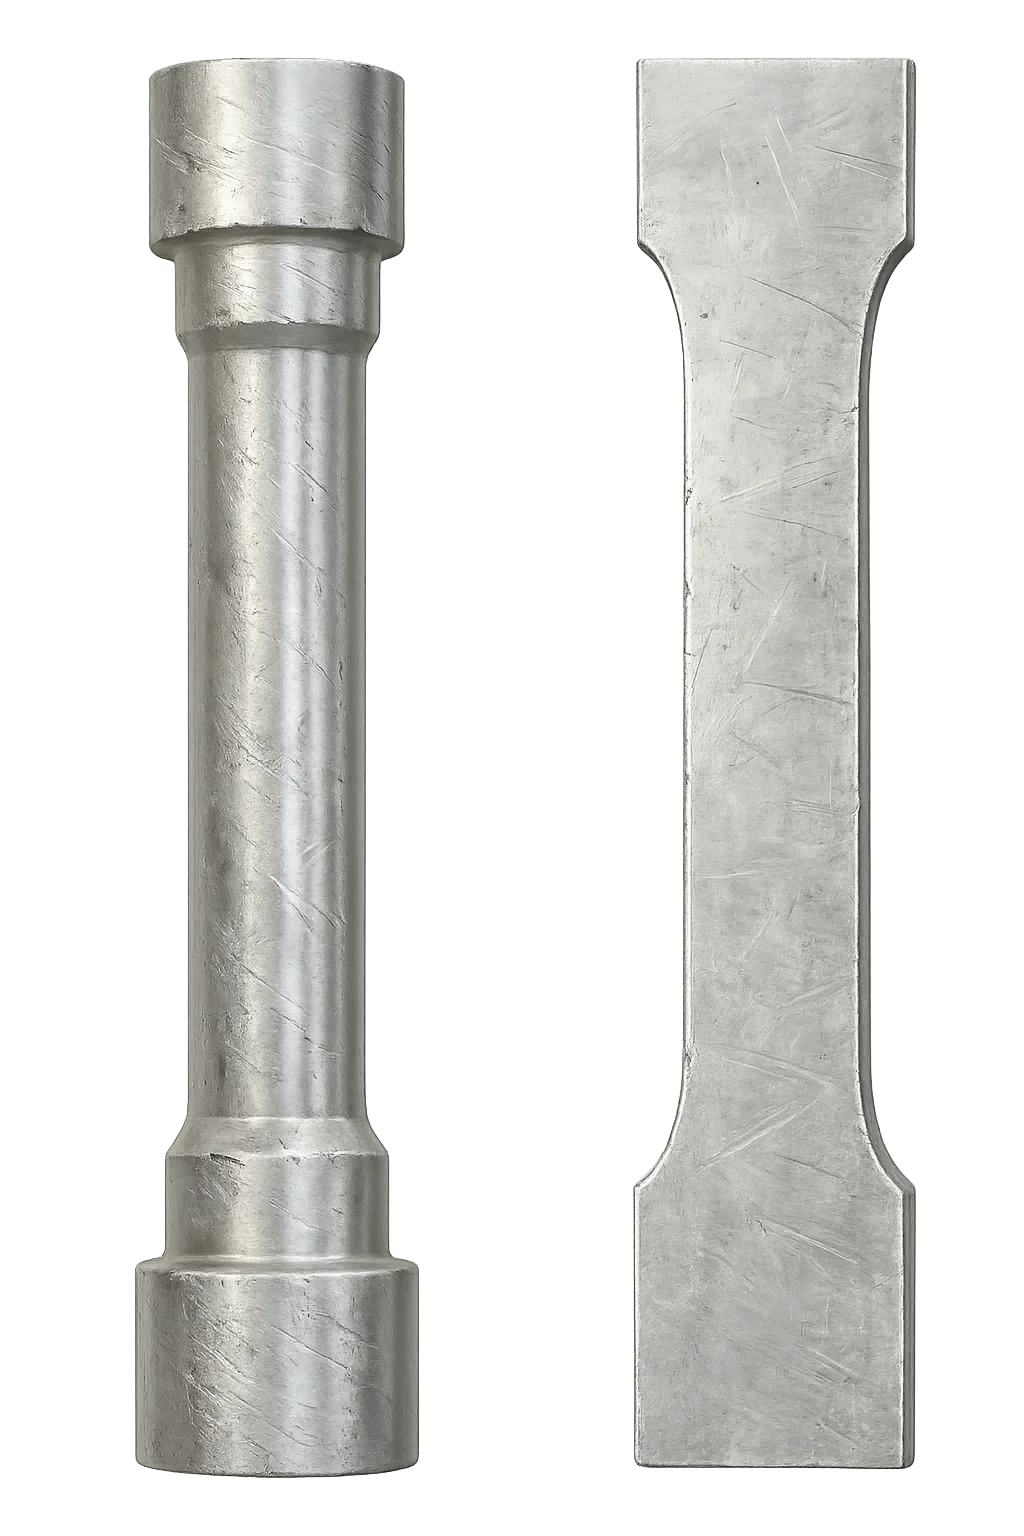
Bias is a systematic shift in reported properties. In tensile testing, engineering stress is calculated from force divided by cross sectional area, so errors in dimensions or measurement practice can directly skew yield strength and ultimate tensile strength. ASTM E8/E8M also notes it is desirable for the smallest area to be at the center of the reduced section, with a small taper permitted to help ensure fracture occurs within the gauge length.
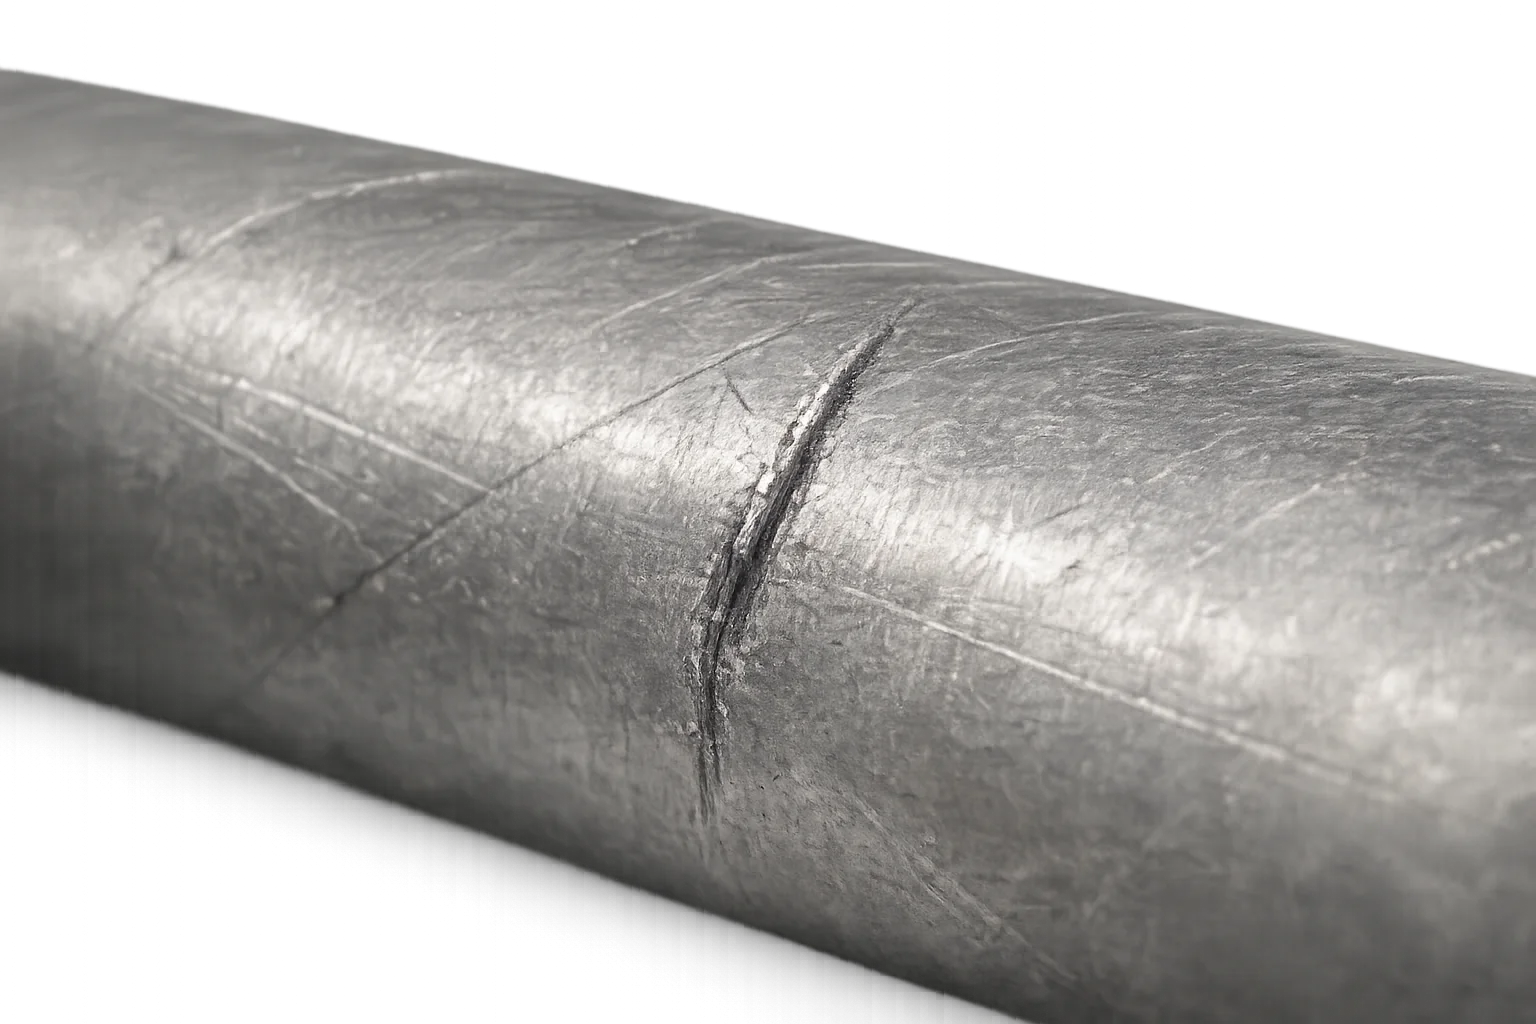
Scatter is an increase in variability between specimens that should be comparable. ASTM E8/E8M requires the reduced section to be free of conditions such as cold work, notches, chatter marks, grooves, gouges, burrs, rough surfaces or edges, and overheating, because these can affect measured properties. It further notes that surface finish uniformity can contribute to variability, particularly for high strength or very low ductility materials.
Where The Cost Comes From
In tensile work, the most common cost driver is uncertainty. If results are biased, teams risk accepting or rejecting material for the wrong reasons. If results scatter, teams lose time to repeats and investigations.
Flat specimens bring a frequent hidden culprit: blanking or punching can create significant cold work and shear burrs. ASTM E8/E8M notes these effects and indicates they should be removed by machining. In practice, labs often see “dimensions are in tolerance, but elongation and fracture behavior do not repeat,” which triggers retests and rework.
Thermal input during machining is another contributor. ASTM E8/E8M explicitly includes overheating among unacceptable reduced section conditions. Uncontrolled heat can alter the near surface state and residual stress, increasing variability and sometimes shifting results.
Impact testing raises the stakes because the method relies on a notch. ASTM E23 states that notches must be smoothly machined and that variations in notch dimensions will seriously affect results, and it provides explicit tolerances and surface finish requirements.
Marking practices can also damage specimens. ASTM E23 states that markings must not be within 10 mm of the notch centerline and cautions that some marking methods can change properties through heating or deformation.
Fatigue testing further amplifies surface effects. ASTM E466 highlights the influence of geometry and surface condition and calls out surface residual stress and surface finish as nuisance variables that must be controlled for reproducibility.
8 Hidden Cost Buckets
Poor specimen preparation rarely shows up as one clean line item. It shows up as a stack of small costs that compound across people, equipment, and schedules. Below is a practical “loss estimate” view of the eight buckets most labs can recognize and quantify.
1.Rework
Rework is the immediate cost of fixing a specimen that should have been right the first time. In practice it is not only re machining, re polishing, or re notching. It also includes the time to diagnose the issue, pull the specimen out of flow, and set it up again.
Typical rework activities include re machining the reduced section, removing burrs or chatter marks, re establishing surface finish, or remaking notch features for impact specimens. ASTM E8/E8M warns that improperly prepared specimens are a common cause of incorrect results, and it lists unacceptable reduced section conditions such as burrs, grooves, chatter, cold work, and overheating. Those are all rework triggers in real labs.
Rework also includes repeat metrology. Dimensional checks are repeated, and when variability is suspected, surface finish is often re verified. For many labs, the most expensive part is not the re machining itself, but the disruption of the planned test queue and the administrative work required to document the corrective action.
2.Scrap
Scrap is the cost of a specimen that cannot be salvaged. It includes the coupon material, the consumables used up to the failure point, and the time already invested.
In materials testing, scrap can be deceptively expensive because coupons may be limited, traceable to a specific heat or lot, or produced from expensive alloys or heat treated material where replacement is slow. When a specimen is scrapped, the lab often has to request a new coupon, repeat preparation, and repeat testing. The scrap event therefore tends to pull other costs behind it, including retest, delay, and capacity loss.
3.Capacity Loss
Capacity loss is what happens when rework and retests consume the time that should have been used for scheduled throughput. This is often where the monthly cost becomes visible to management.
Two bottlenecks usually show up. The first is the test frame. When UTM time is consumed by repeat tests, the queue grows and report dates slip. The second is specimen preparation itself. When the prep area is pulled into rework cycles, planned output drops and downstream testing becomes stop start. The net effect is longer lead time per report, even if headcount does not change.
4.Data Integrity Loss
Data integrity loss is the cost of results that are technically produced, but not trusted. This is often the most expensive bucket because it creates uncertainty and multiplies downstream work.
It shows up as elevated scatter, unexplained outliers, and non agreement between shifts, operators, or fixtures. ASTM E8/E8M notes that surface finish uniformity can contribute to variability, particularly for high strength or very low ductility materials, which is a direct link between preparation and scatter.
The cost is not just retesting. The cost is the investigation cycle. Teams review specimen condition, fracture location, measurement methods, and whether the reduced section meets the standard’s expectations. Work pauses while people decide whether the data is usable, comparable, or defensible.
5.Decision Delays
Decision delays are the business cost of waiting for reliable answers. A single questionable tensile result can ripple into production, quality, and engineering decisions.
Common patterns include holding a lot release, delaying a supplier approval, pausing a heat treatment window decision, or repeating an R and D iteration because the data does not reconcile. In many organizations, the cost of the delay exceeds the direct cost of remaking specimens, especially when multiple stakeholders are blocked and the timeline becomes uncertain.
6.Compliance And Audit Readiness
Compliance cost appears when you cannot prove that specimens were prepared consistently, to tolerance, and in a traceable way. This is where “we think it is fine” becomes “we can demonstrate it is fine.”
Impact testing is a clear example. ASTM E23 states that variations in notch dimensions will seriously affect results, which is why it provides tolerances and explicitly controlled geometry. It also includes marking restrictions and cautions that some marking methods can change properties through heat or deformation. If you cannot show that notch geometry, marking, and preparation method were controlled, results can be challenged.
For accredited or accreditation minded labs, the same idea maps to validity of results practices. ISO and ISO IEC 17025 related guidance emphasizes demonstrating competence and generating valid results, including monitoring validity and detecting trends where practical. Poor specimen preparation makes that evidence trail harder to maintain.
7.Reputation And Customer Disputes
Reputation cost is what happens when a customer, auditor, or internal stakeholder concludes that results are not comparable or defensible. This can trigger forced retesting, repeated qualification work, or contractual disputes.
In practice, disputes often arise not from a single bad number, but from patterns. Results that shift between batches, fracture locations that look inconsistent, or impact values that do not match expectations can lead to the conclusion that preparation was uncontrolled. Once that trust is lost, the lab pays for additional evidence, additional testing, and additional review cycles.
8.Safety And Liability
Safety and liability costs should be mentioned briefly and factually. In safety critical industries, decisions based on biased or unreliable mechanical properties can lead to incorrect design allowables, incorrect acceptance decisions, or incorrect assessments of margin.
It is simply the highest consequence version of the same chain. When preparation degrades data quality, the risk is not only cost and schedule. It is decision quality.
Optional COQ Insert
If your audience includes executives or finance stakeholders, you can add a short insert framing these buckets using Cost of Quality language. ASQ describes cost of quality as resources spent on prevention, appraisal, and internal and external failures. Poor specimen preparation typically sits in internal failure cost, but it can also drive external failure cost when customers reject or challenge results.
Quick Calculator To Estimate Monthly Losses
This section gives a simple, defensible way to translate specimen preparation problems into monthly cost. The goal is a baseline estimate that helps you see where the process is leaking time and money.
Inputs You Can Collect In 15 Minutes
N: specimens per month
r: problematic specimen rate, including scrap, rework, and questionable results that trigger retest
Tprep: average preparation time per specimen, in minutes
Ttest: average test and reporting time per specimen, in minutes
Clab: fully burdened labor rate, dollars per minute
Cutm: UTM burdened rate, dollars per minute
Cmat: coupon material cost per specimen
Ccons: consumables cost per specimen
Monthly COPQ Formula
Monthly COPQ ≈ N × r × [ (Cmat + Ccons) + (Tprep × Clab) + (Ttest × (Clab + Cutm)) ]
If you want to model production impact, you can add a separate decision delay scenario line. Keep it separate, because it depends heavily on your operation and cannot be generalized.
Two Worked Examples
Example A, Mid Volume QA Lab
N = 400 specimens per month
r = 6 percent, 24 specimens
Tprep = 25 minutes, Ttest = 20 minutes
Labor burden = 85 dollars per hour, 1.42 per minute
UTM burden = 60 dollars per hour, 1.00 per minute
Cmat = 18 dollars, Ccons = 4 dollars
Per problematic specimen cost
(18 + 4) + (25 × 1.42) + (20 × (1.42 + 1.00))
= 22 + 35.5 + 48.4
≈ 106 dollars per specimen
Monthly COPQ ≈ 24 × 106 ≈ 2,544 dollars per month, about 30k per year
Example B, High Volume Production Testing Cell
N = 2,500 specimens per month
r = 3 percent, 75 specimens
Using the same time and rate assumptions
Monthly COPQ ≈ 75 × 106 ≈ 7,950 dollars per month, about 95k per year
Why A Retest Costs More Than The First Test
A retest includes more than another pull to failure. It adds time for root cause checks, additional dimensional or surface inspection, and the documentation of corrective actions. It also disrupts the queue and often triggers coordination between QA, engineering, and sometimes the customer. This is why retest cost grows faster than the direct minutes spent on the test frame.
How To Reduce Losses With A Three Level Process Maturity Model
Reducing retests and rework is primarily a process problem. The fastest improvements come from making specimen preparation repeatable, measurable, and harder to do incorrectly. Below is a practical three level maturity model that labs can apply without turning specimen prep into a bureaucracy.
Level 1: Control And Discipline
Start by removing ambiguity. Define clear work instructions for each specimen type and standard geometry, including what is allowed and not allowed in the reduced section. ASTM E8/E8M is explicit that the reduced section must be free of defects and conditions that can affect measured properties, so your WI should reflect that reality.
Add a minimum metrology set that is always performed. For most tensile workflows this means verifying critical dimensions and doing a focused visual inspection of the reduced section. Include simple rules for gauge marks. ASTM E8/E8M notes that repeated fracture at gauge marks can indicate marks are too deep or sharp and are influencing results, so gauge marking needs a defined method and red flags.
Finally, define what not to do. Avoid ad hoc hand finishing in the gauge area if it changes the actual cross sectional area or surface condition without control. ASTM E8/E8M cautions against edge or corner grinding in a way that significantly changes the actual area relative to the calculated area for rectangular specimens.
Level 2: Standardization Across People And Shifts
Once the basics are controlled, standardize the physical setup and the decision points. Use consistent workholding and datuming so geometry is not dependent on “operator technique.” Pair that with a template approach. Maintain route sheets for the standard geometries you run most often, such as ASTM E8/E8M and ISO 6892 1 tensile specimens, so the prep path is the same regardless of who is on shift.
Add tool management as a standard practice. Define wear monitoring rules, limits, and a first article check after a tool change or any event that could affect finish or dimension. Surface roughness verification should be selective but intentional, for example on first articles, after crashes, after tool changes, and more frequently for fatigue coupons where surface condition is a primary driver of life. ASTM E8/E8M highlights surface finish uniformity as a contributor to variability, and ASTM E466 calls surface finish and residual stress nuisance variables that must be controlled for reproducibility.
Level 3: Human Error Reduction Through Built In Workflow
At the highest maturity level, the goal is not to train perfect operators. It is to make common errors difficult. Use workflows where the operator selects the relevant standard and parameters, then runs a controlled preparation path with minimal opportunities for undocumented manual changes.
Stability comes from an embedded process. Pre defined geometries, controlled preparation steps, consistent updates, and reliable support all reduce drift over time and between shifts. The practical outcome is fewer questionable results and fewer “investigation loops” triggered by preparation variability.
To validate the system, include an internal control method such as a golden coupon or control material run periodically. The purpose is to detect drift early, before it becomes a spike in retests. This aligns with the general ISO IEC 17025 quality maturity concept of monitoring the validity of results and detecting trends where practicable.
Pre Test Checklist Before Running Mechanical Tests
Use this checklist as a final gate before testing. It is tensile first, with add ons for impact and fatigue.
Confirm the reduced section is free of burrs, grooves, chatter marks, gouges, rough edges, cold work, and any signs of overheating. ASTM E8/E8M treats these as unacceptable conditions because they can affect measured properties.
Verify critical dimensions and record the measurement method where required by your quality system. Ensure the smallest area is centered in the reduced section so fracture is expected within the gauge length, consistent with ASTM E8/E8M guidance.
Confirm edges and corners in the reduced section have not been abraded in a way that changes actual area relative to the calculated area. Check gauge marks. If your lab sees frequent fracture at gauge marks, treat it as a process defect and correct the marking method.
For flat coupons produced by blanking or punching, confirm burrs and cold worked layers have been removed by machining. ASTM E8/E8M notes blanking can introduce significant cold work and shear burrs that should be removed
For Charpy impact specimens, confirm the notch is smoothly machined and within tolerances, and that applicable surface finish requirements are met. ASTM E23 states that variations in notch dimensions will seriously affect results. Confirm there are no markings within 10 mm of the notch centerline, and that the marking method has not heated or deformed the specimen.
For heat treated impact specimens, confirm finish machining and notching were performed after final heat treatment unless equivalence has been demonstrated.
For fatigue specimens, treat surface finish and residual stress as controlled variables. Avoid uncontrolled hand finishing, and document the preparation route so results remain reproducible. ASTM E466 explicitly identifies surface finish and surface residual stress as nuisance variables that must be controlled for reproducibility.
Turning Specimen Preparation Into A Controlled Process
Poor specimen preparation rarely looks like a single failure. More often it shows up as bias, scatter, and repeated exceptions that consume capacity and delay decisions. When specimen geometry, surface condition, and traceability steps are controlled, tensile results become more repeatable, investigations decrease, and reports become easier to defend with customers and auditors.
The practical next step is straightforward. Track your retest and rework rate, standardize your preparation route for the geometries you run most, and use a simple monthly COPQ estimate to make the cost visible. Once the process is measurable, it becomes much easier to improve.
If your specimen preparation equipment is causing instability, downtime, or inconsistent output, we can help. We have supplied specimen preparation systems for materials testing for many years and support labs in building repeatable, standards aligned workflows. Request a quote or contact us, and our team will review your application, answer technical questions, and recommend a practical path forward.